It's no secret that Spring applications can sometimes freeze at startup. This is especially noticeable as a project develops: the new service starts quickly and shows great responsiveness, then it acquires some serious functionality, and the final distribution package swells by dozens of megabytes. Now, to simply launch that service locally, you have to wait for half a minute, a minute, two... At such moments of waiting, the developer may ponder: why on Earth is it taking so long? What’s going on? Maybe I shouldn't have added that particular library?
Hi, my name is Alexey Lapin, and I am a Lead Developer at Luxoft. In this article, I’ll talk about a web application for analysing the startup phase of Spring Boot services, which uses data from the startup actuator endpoint. This tool may help answer the questions above.
Foreword
I made this application for myself to understand a new Spring module that I hadn't seen before and practice on the front end. I saw various solutions on the internet, but they either did not work or have not been updated for a long time, and I wanted to create an up-to-date auxiliary tool for the Spring Boot functionality.
Spring Boot Startup Endpoint
Starting with version 2.4, Spring Boot has an ApplicationStartup metric that records events (steps) that occurred during the service startup and an “actuator endpoint” that makes a list of these events.
Here's what it looks like:
{
    "springBootVersion": "2.5.3",
    "timeline": {
        "startTime": "2021-09-06T13:38:05.049490700Z",
        "events": [
            {
                "endTime": "2021-09-06T13:38:05.159435400Z",
                "duration": "PT0.0898001S",
                "startTime": "2021-09-06T13:38:05.069635300Z",
                "startupStep": {
                    "name": "spring.boot.application.starting",
                    "id": 0,
                    "tags": [
                        {
                            "key": "mainApplicationClass",
                            "value": "com.github.al.realworld.App"
                        }
                    ],
                    "parentId": null
                }
            },
            ...
            {
                "endTime": "2021-09-06T13:38:06.420231Z",
                "duration": "PT0.0060049S",
                "startTime": "2021-09-06T13:38:06.414226100Z",
                "startupStep": {
                    "name": "spring.beans.instantiate",
                    "id": 7,
                    "tags": [
                        {
                            "key": "beanName",
                            "value": "org.springframework.boot.autoconfigure.internalCachingMetadataReaderFactory"
                        }
                    ],
                    "parentId": 6
                }
            },
            ...
        ]
….}
}
A detailed description of all message fields can be found in the Spring Boot Actuator documentation, but I think it’s all in all pretty straightforward. The event has an “id” and a “parentId”, which allows one to have a tree view. There is also a “duration” field, which shows the time spent on the event + the duration of all associated events combined. The “tags” field contains a list of event attributes, such as the name or class of the generated bean.
To enable the collection of data on load events, you must pass an instance of the BufferingApplicationStartup class to the setApplicationStartup method of SpringApplication. In this case, a constructor is used that accepts the number of events to record. All events above this limit will be ignored and will not be included in the startup endpoint’s output.
@SpringBootApplication
public class App {
    public static void main(String[] args) {
        SpringApplication application = new SpringApplication(App.class);
        application.setApplicationStartup(new BufferingApplicationStartup(1000));
        application.run(args);
    }
}
By default, this endpoint has a path of /actuator/startup and supports GET methods for receiving events and POST for receiving events and clearing the buffer, so subsequent calls to this endpoint will return an empty list of events
Okay, let's go. We will consider the information provided by the startup endpoint as our data for analysis. The analyser web application is a single-page application (SPA) without a back end. It works like magic: you just need to upload the events that occurred during the service startup, and it will visualise them. The uploaded data is neither transferred nor stored anywhere.
I chose Typescript as my go-to programming language, as it seemed like a better option for a Java developer compared to Javascript due to its strong typing and object-oriented programming features. I found it very easy to switch from Java to Typescript and quickly write a working code. As my UI framework, I chose Vue.js 3. To be clear, I have nothing against React, Angular and other front-end frameworks, but at that time Vue.js seemed like a good option due to the low entry threshold and excellent preset tools. Then it was time to choose the component library. It needed to be compatible with Vue.js 3 and have components for working with tables. I considered Element Plus, Ionic Vue, and Naive UI, but due to the availability of customisable components for working with tables, I ended up using the PrimeVue library.
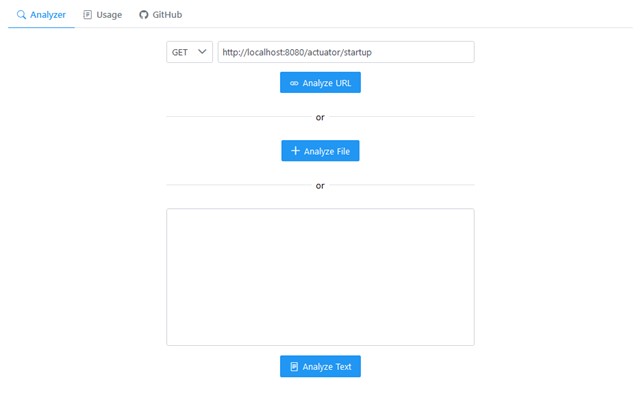
The application has a navigation bar with Analyser elements (this is the main screen of the application), Usage (user instructions) and a link to the project's GitHub repository.
The main page of the application displays a form for entering data, which can be done in three different ways. The first way is to put a link to the deployed Spring Boot service. In this case, an HTTP request will be made to the specified endpoint and the data will be uploaded automatically. This method is applicable for cases when the service is available from the internet or is deployed locally. Note that loading by url may require additional service configuration in terms of CORS headers and Spring Security. The second and third ways are loading a JSON file or its actual content.
The deployed application is located at https://alexey-lapin.github.io/spring-boot-startup-analyzer/
For the analyser demo, I used my own Spring Boot service deployed on Heroku. This service implements the back end of the RealWorld project. The desired endpoint can be found at https://realworld-backend-spring.herokuapp.com/actuator/startup. The service is configured to send correct CORS headers to GET requests from the analyser.

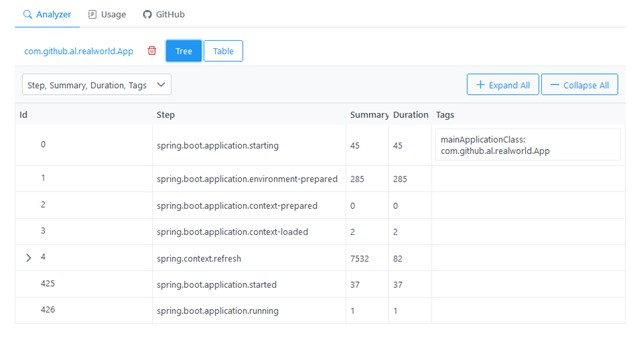
Once you load the events using one of the specified methods, the data is visualised in a tree structure. Note that all rows that have child items are hidden. To navigate through this tree, you can use the “>” icons to the left of the item ID, or expand/hide all rows simultaneously using the Expand All / Collapse All buttons.
If there are many events, it may take some time to render the expansion of all rows.

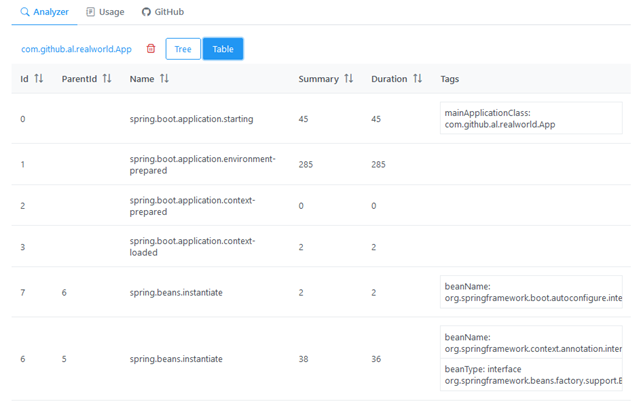
In the table view, all events are displayed at once. All columns, except for Tags, can be sorted.

CI + hosting
On one of the previous projects, I was involved in the global DevOps transformation of our client and worked on automating the release cycle processes and building CI/CD pipelines. It was an interesting experience, which now helps me to resolve issues related to writing the source code of products. In this case, as with most of my open-source software projects, I used GitHub as my git hosting, as it provides many useful tools for CI, artefact storage, documentation, project management, static site hosting, etc. For the needs of the analyser, I specifically used Actions and Pages.
GitHub Actions is configured to run a workflow on events like “pull request”, “commit to master”, and “push a tag”. Pushing a tag will also deploy the assembled project to GitHub Pages, as well as build the Docker image and send it to Docker Hub.
In addition to the analyser’s public instance on GitHub Pages, you can use the Nginx-based Docker image. The latter can be useful, for example, for those cases when Spring Boot services are located on the organisation's internal network, from which there is no internet access, but Docker is available and it is possible to load the image.
To start the container, run the following command:
docker run -d --name sbsa -p 8080:80 lexlapin/spring-boot-startup-analyzer
If you need to access this container through a reverse proxy, then pass the path through the environment variable:
(UI_PUBLIC_PATH):
docker run -d --name sbsa -p 8080:80 -e UI_PUBLIC_PATH=/some-path lexlapin/spring-boot-startup-analyzer
Things to improve
In the future, I plan to refine the screen with the analysis results. Plus, it would be useful to add a tab with a summary of event types, their number and total elapsed time, such as the number and total time spent to create beans. Another possible feature is building charts on short pivot tables — especially since PrimeVue provides such an opportunity through the Chart.js library. In tree view and table view, colour coding can be done to highlight long events. Additionally, it is worth adding event filtering — for example, by type.
Conclusion
The proposed analyser allows one to conveniently visualise the data received from the startup actuator endpoint, estimate in detail the time spent on various types of events that occur during the service startup, as well as generally process startup information more efficiently. The application has a public instance on GitHub Actions and is also available as a Docker image. This application was successfully used on one of Luxoft’s projects to analyse the loading of slowed-down services and helped to detect several classes with suboptimal logic in the constructors.


1 komentar